If you were to ask me which of all the candlesticks is the most important to recognize and study, I would answer unhesitatingly — the doji. Whatever timescales your are using, or whichever markets you are trading, the doji candle will appear day in, day out and week in, week out, providing us as traders with an endless stream of signals to use in our trading. Fail to recognize the doji’s implications and you run the risk of buying at the top or staying far too late in a trade and leaving substantial profits on the table. The simplicity of the doji belies its power, and the simple explanation is that the opening and closing price are the same or very close – in other words three is virtually no body whatsoever with the candle, but with shadows top and bottom.
| ROBOT | RATING | PROPERTIES | TRADE |
|
Free to use |
|
Try Immediate Edge |
In general there are four main types of dojis — common, long-legged, dragonfly and gravestone, but all have one thing in common in that prices opened and closed at the same level. If prices close very close to the same level (so that no real body is visible), then that candle is read as a doji. In simple terms the doji candle is telling us that the bulls and the bears have battled during the period but that neither has won, and indecision has now entered the market with no clear direction.
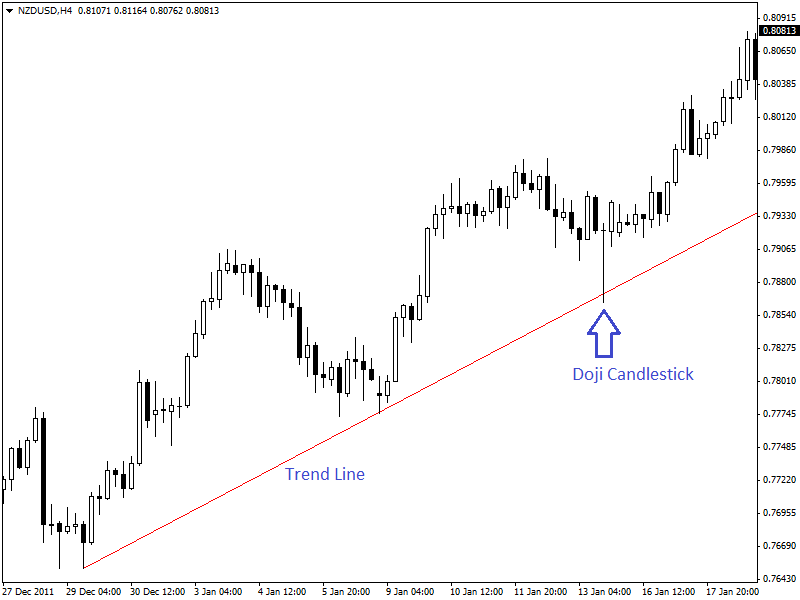
This in a nutshell is the power of the doji candle – it is telling us that the trend is stalling, and that this may be the first signal that a reversal is about to occur. In the case of an uptrend, the bulls have by definition won previous battles since prices have moved higher. Now, the outcome of the latest skirmish is in doubt and the move may be coming to an end. Similarly, after a long downtrend, the opposite is true. The bears have been victorious in previous battles, pushing prices lower, but the bulls have now entered the market in force and pushed prices back up to close near the open. All of this price action is reflected in the simple doji candle, and is the first sign that the move may be coming to an end.
Now it is important to realise that the candles that go before are just as important as the doji signal itself. By this I mean that is prices are ranging sideways or consolidating then the doji has less or little relevance. However if we see a doji candle appear after a long rally or a steep decline, then this carries considerable weight, as the preceding trend has been a strong rally, or a steep fall. This is where the power of the doji comes into its own – at the top or bottom of a strong move which can be the first signal ina trend reversal – so pay attention! I will be showing you examples as I find them in a variety of markets and charts over the next few months which I hope will build into a library for you of real trading signals in real markets.
| ROBOT | RATING | PROPERTIES | TRADE |
|
Free to use |
|
Try Immediate Edge |